Flow of the Week: Show real-time weather data in Power BI


Last week we announced that you could stream data real-time from Microsoft Flow to Power BI. Read Sirui's full blog post here for the announcement and a full walkthrough for gauging Twitter sentiment with Flow and Power BI.
For this week's Flow of the Week we want to highlight another Power BI and Flow streaming scenario brought to us by Kawabata Yoshihiro here. This flow will populate a tile on a Power BI dashboard showing weather for a location you choose.
Set up the streaming data source
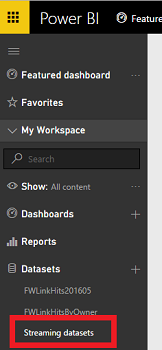
If you already use Power BI, sign in, otherwise you can sign up for Power BI for free here. Once logged in, select Streaming datasets in the left navigation inside your workspace:
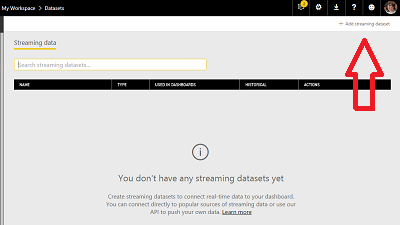
Next, you will select Add streaming dataset in the command bar:
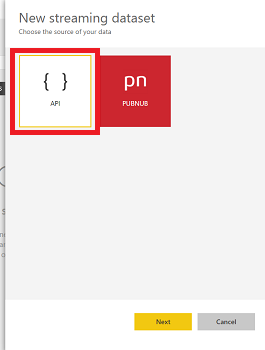
In the New Streaming Dataset panel select API:
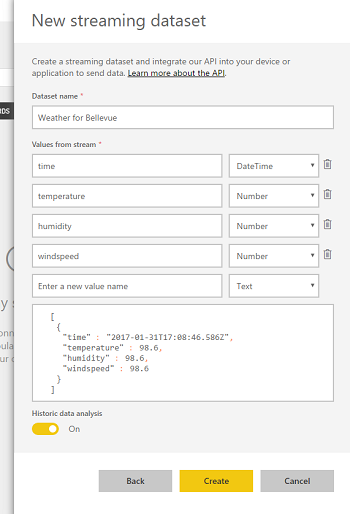
Now you will name your dataset's values and their type. For this example, you can have fields like time, temperature, windspeed and humidity. For the time field select DateTime and select Number for the other fields:
Congratulations, you have now set up your streaming dataset that will receive the data from flow!
Set up your flow
You will create a flow from scratch to stream the data. Start by going to your My Flows page and selecting Create from Blank.
The first step in a flow is to add the trigger. This flow will be triggered based on a schedule – for example, every 15 minutes. Select Schedule in the trigger services and then Recurrence:
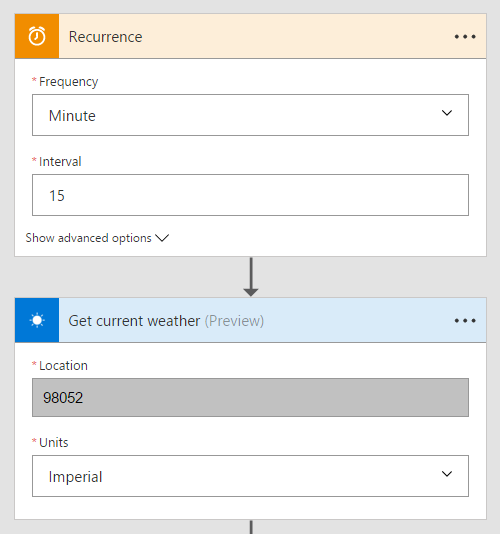
Next, add a step to get the current weather. You can find that step by searching inside of the Choose an action card. Fill in the Location you want weather for and the units you want the data in. The final step in the flow is Add rows to a dataset:
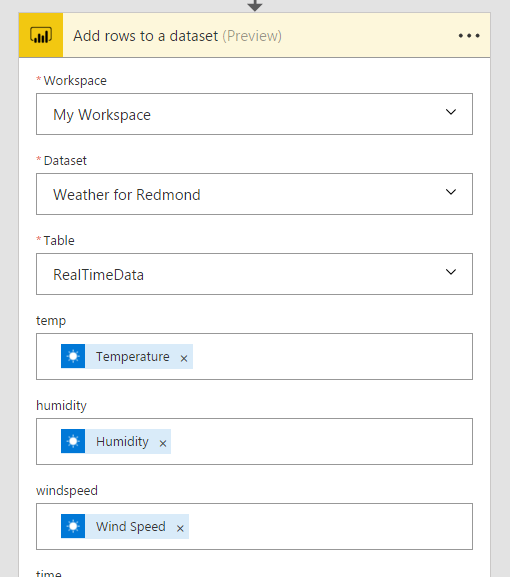
Inside this step you will select your Workspace, Dataset, and then table (which will always be RealTimeData). Pass in the data from the weather step you want to use by selecting Add Dynamic Content. For the time field, you can type in: 20@{utcnow('yy-MM-ddTHH:mm:ssK')} which will populate the time in a format that Power BI expects. Once you have configured the step, create the flow and it will start running.
Add the tile to your dashboard
The part of this tutorial is to add the tile to your dashboard. You can create a new dashboard or use an existing on in Power BI. Select Add tile in the command bar:
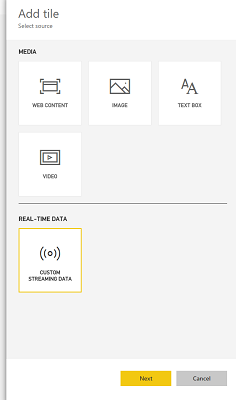
Select Custom Streaming Data and then the dataset that you created in the first part of this tutorial. Then, you will configure your tile:
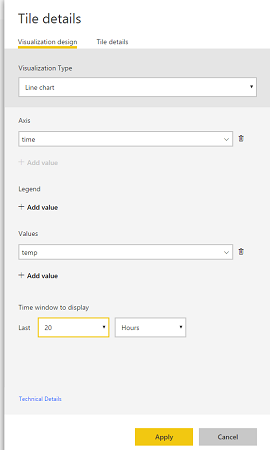
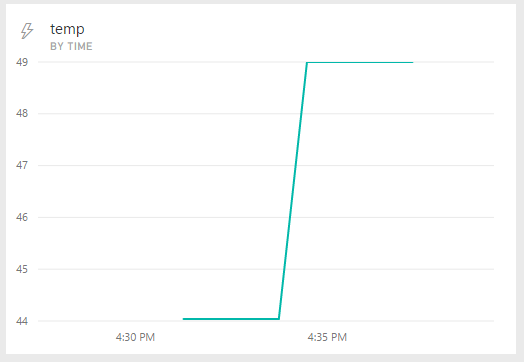
For the tile, you will select the axis as the time series, and then display whichever weather measure you want as the values on the chart. You should now be all set, and see data appear on your dashboard in real-time:
In just a few minutes you have been able to set a new streaming data source for Power BI without writing a single line of code. We recommend also checking out this scenario for streaming Twitter data to a Power BI dashboard.