Advanced | Flow of the Week: Get a daily email with the top failures captured in Application Insights


Today, i would like to show you how to address an issue which has been surfaced by one of our partners. As the Application Insights team recently shared with us, one of the most common questions from their users is: "How do I get periodic emails with the results of an Analytics query?".
Let's build a flow which does precisely that. There is now a very simple answer for this, thanks to the new Azure Application Insights connector which was recently introduced.
As an example, let’s create a flow that sends daily emails with the details of correlated requests and exceptions that caused the most application failures in the past 24 hours.
To make things even more interesting, not only will we list everything that went wrong in the application, but also group the failures into clusters using the auto-cluster algorithm. This will give us a better understanding of what are the common properties between the groups of failures.
As a side note, auto-cluster is just one of many advanced algorithms available in Application Insights Analytics that allow you to build sophisticated queries that detect and diagnose disruptive trends and anomalous segments in your data (learn more).
Let’s get started
- Sign in at: https://flow.microsoft.com and select My Flows.
- Click Create a flow from blank.
Add a trigger
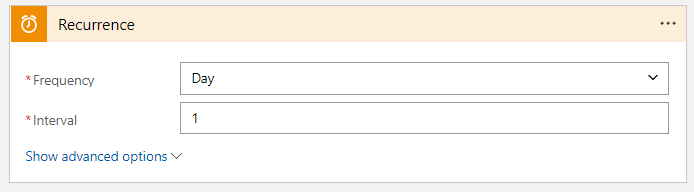
- Choose Schedule and then Schedule – Recurrence.
- Set the Frequency to Day with an Interval of 1.
Add an Azure Application Insights action
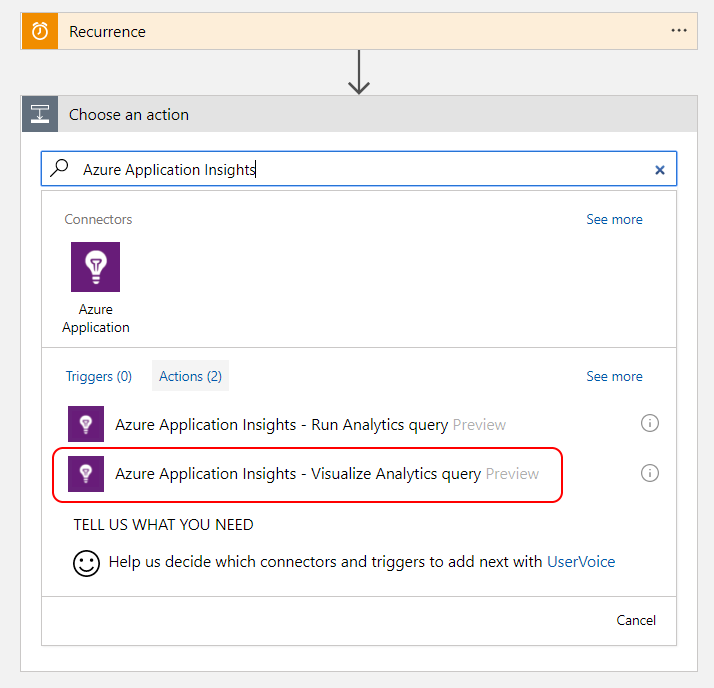
- Click New step and then on Add an action.
- Search for Azure Application Insights.
- Click Azure Application Insights – Visualize Analytics query Preview.
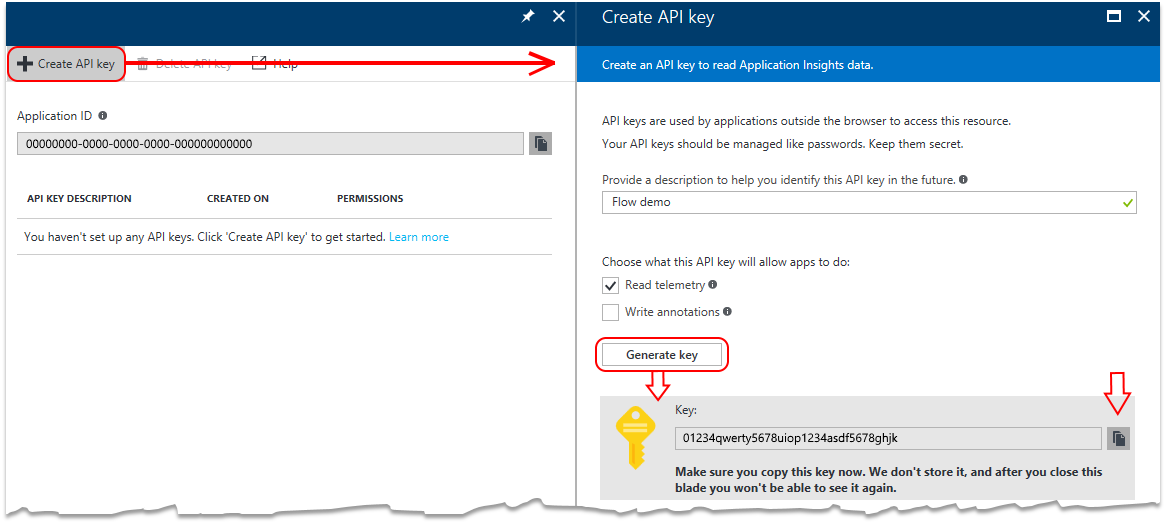
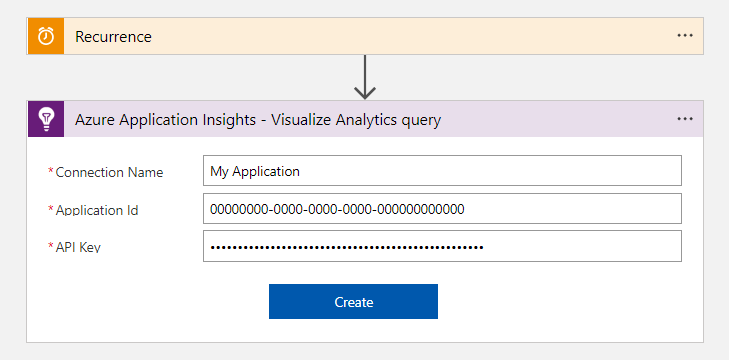
Connect to an Application Insights resource
To query data from your Application Insights resource, you need an Application ID and an API Key. You can retrieve them from the Azure Portal as demonstrated in the following diagram:
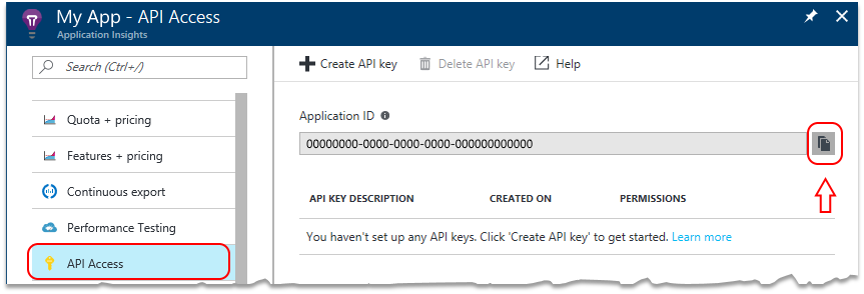
Once obtained, go back to your flow, provide a name for your connection along with the Application ID and API Key.
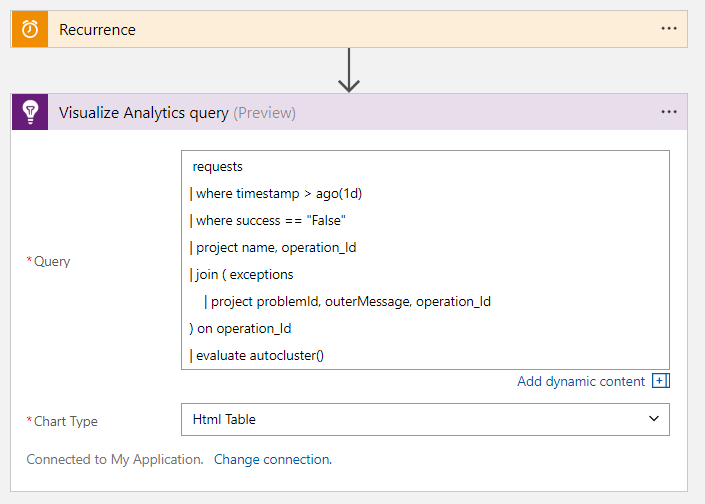
Specify the Analytics query and chart type
This example selects the failed requests within the last day and correlates them with exceptions that occurred as part of the operation. Analytics correlates using the operation_Id identifier. The query then segments the results using the auto-cluster algorithm.
As a side note, when creating your own queries, make sure to verify that they are working properly in Analytics before adding them to your flow.
Add the following Analytics query and select the Html table chart type:
requests
| where timestamp > ago(1d)
| where success == "False"
| project name, operation_Id
| join ( exceptions
| project problemId, outerMessage, operation_Id
) on operation_Id
| evaluate autocluster()
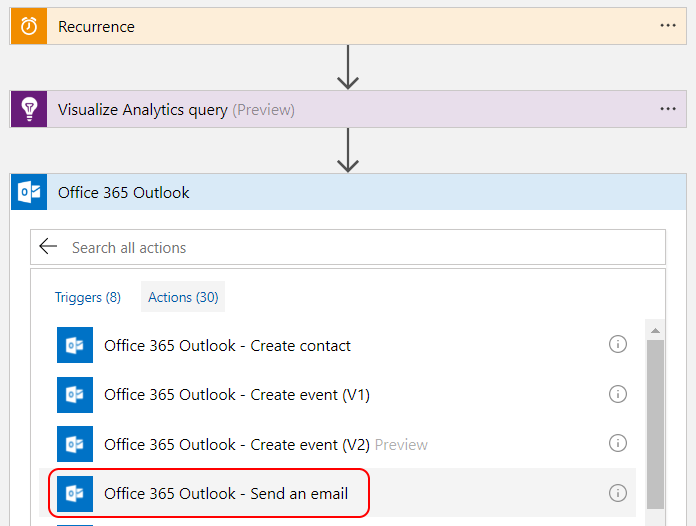
Configure the flow to send email
- Click New step and then select Add an action.
- Search for Office 365 Outlook.
- Click Office 365 Outlook – Send an email.
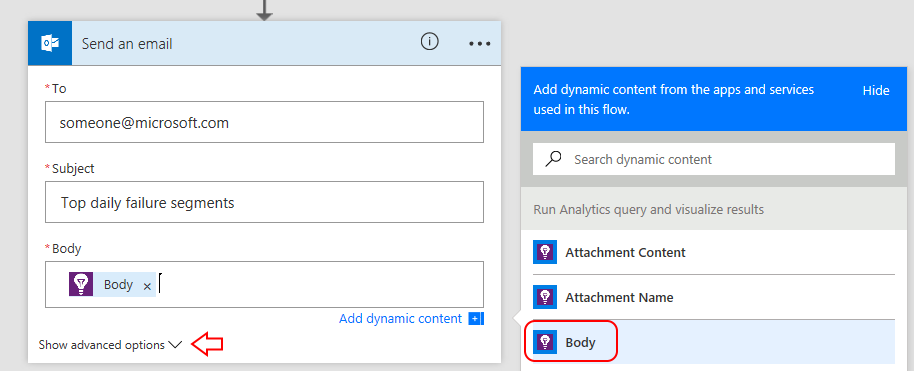
4. In the email action add the following data:
- Specify the email address of the recipient
- Provide a subject for the email
- Place your cursor in the Body field, and from the dynamic content menu that opens on the right, select Body.
- Click on Show advanced options.
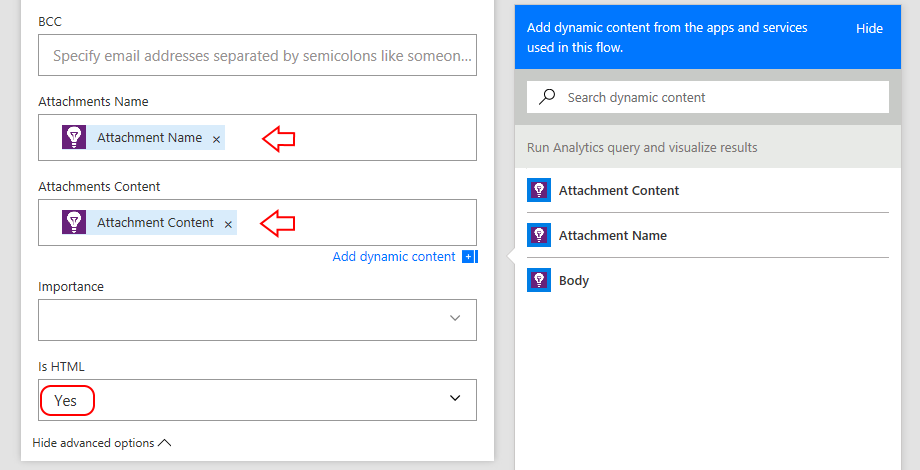
5. From the dynamic content menu do the following:
- Select Attachment Name
- Select Attachment Content
- Select Yes in the Is HTML field
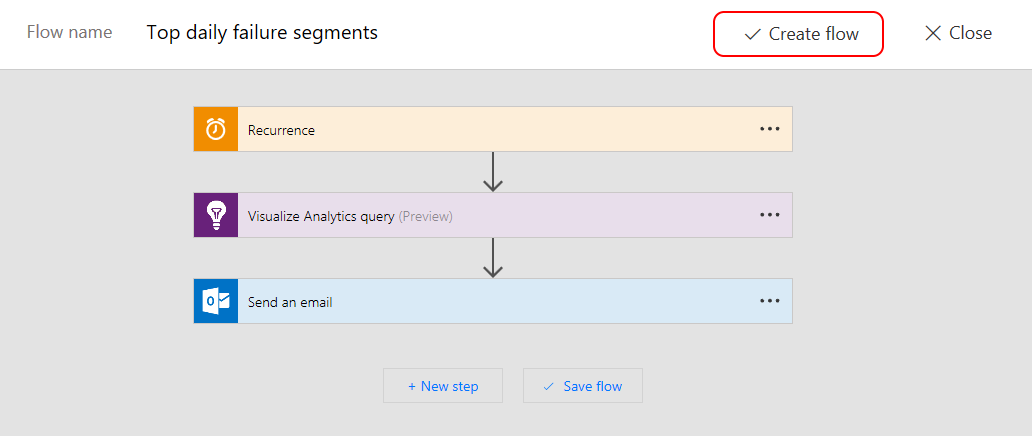
Save and test the flow
Add a name to your flow and click Create flow.
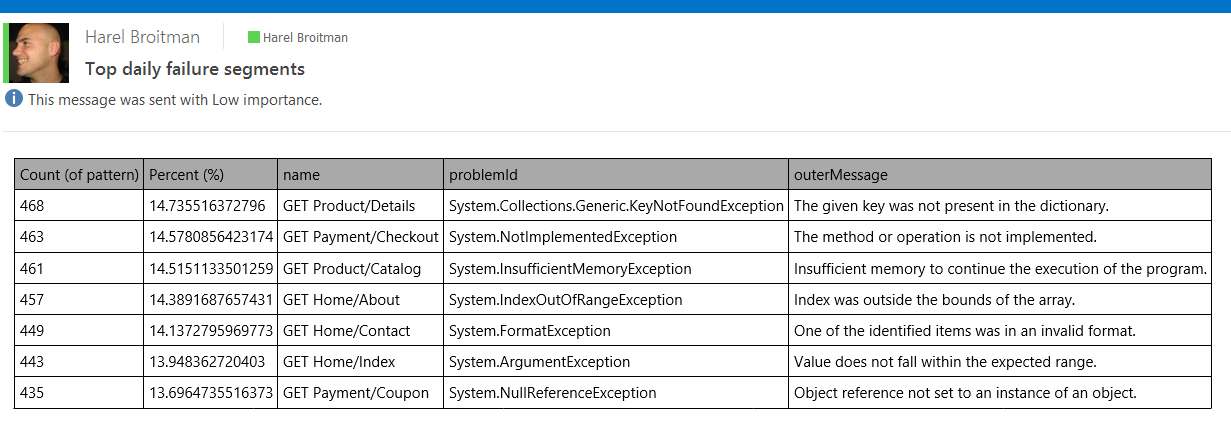
We’re all done! Let’s run the flow to see what the result looks like (it should look like the below):
Give it a try
We’d love to get your feedback. Did you find it useful? Can we make it better somehow?
Please let the team know here.