Advanced Power Automate RPA run log analytics with Power BI and Dataverse


We’re excited to announce the availability of a new Desktop flow run analytics dashboard.
This dashboard can be used across IT Operations, RPA CoE and business users to analyze desktop flow run logs and their performances, in a fully customizable Power BI starter template.
Besides the performance-based analytics, it also provides pro-code script reporting for actions like Invoking Web services, VBScript, PowerShell and even Python giving you the insights needed to control and govern your RPA deployment across the Microsoft Dataverse environment.
No additional Power Platform components are required to deploy the starter template since it directly imports the relevant Microsoft Dataverse tables through its Web API platform. This dashboard is complementary to the very comprehensive dashboard found in our CoE Starter Kit.
A deep-dive walkthrough of a sample dashboard implementation can be watched here on the Automate It YouTube series and a setup video can be found here.
Get your copy of the dashboard today and start analyzing Desktop flow run logs with Power BI.
Dashboard highlights
Overview | ||
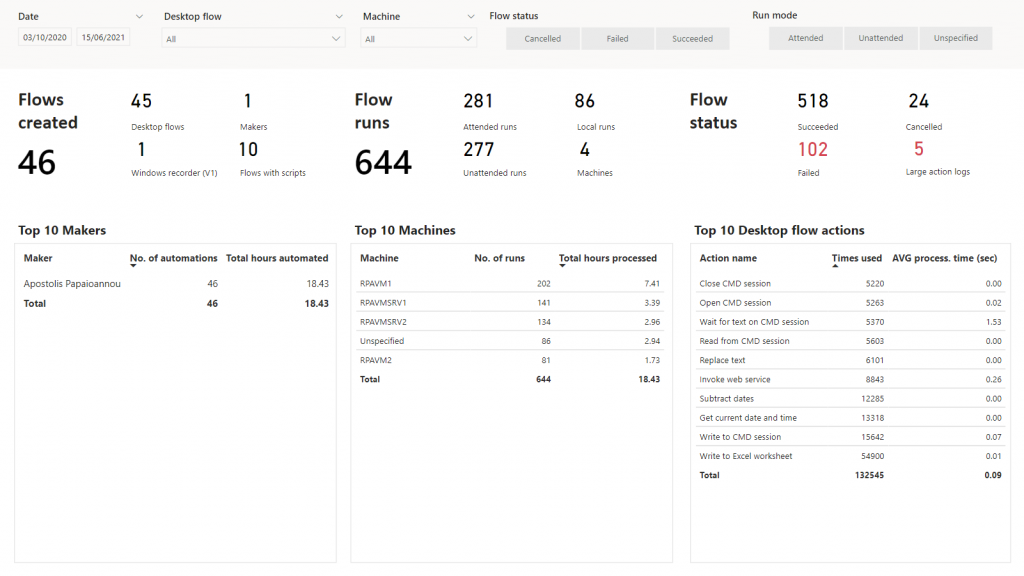
| The Overview report shows desktop flow run statistics with information such as flows by run mode and status, but also action insights and pro-code scripting usage.
| 
| |
Desktop flows | ||
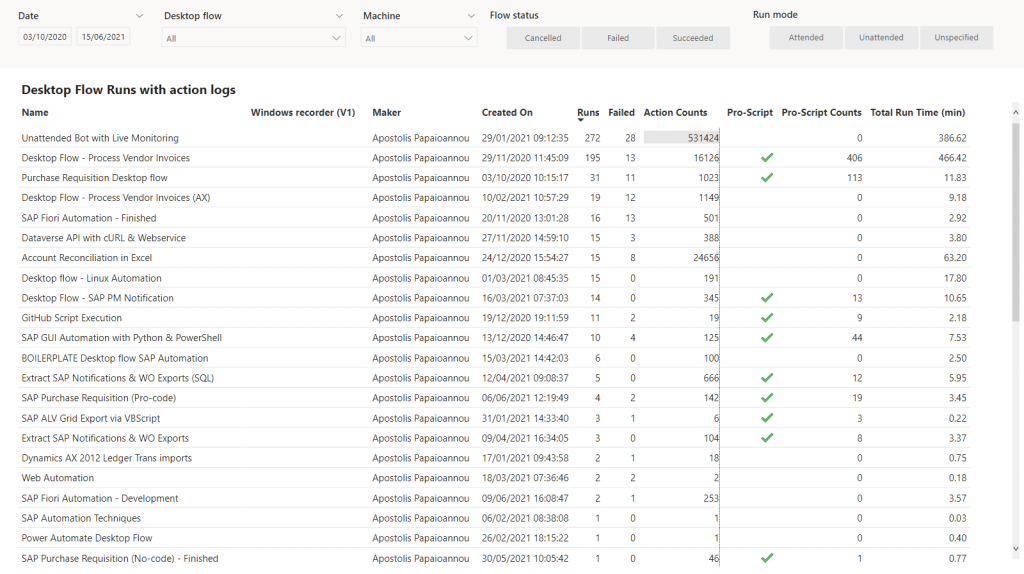 | The Desktop flow report list all desktop flows within a specific environment with basic statistics. The Pro-Script check mark indicates that there are flow runs that include actions like Run VBScript, PowerShell, Python etc.
| |
Desktop flow runs | ||
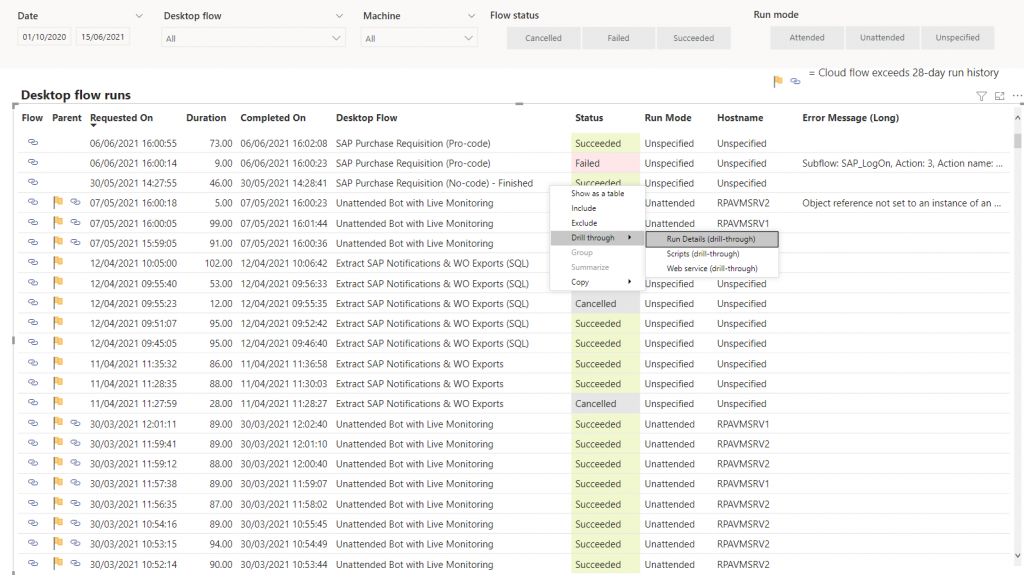
| The Desktop flow runs report will list all flow runs with their status, run duration, run mode and potential error message. Multiple filters can be applied enabling efficient and powerful flow run monitoring.
| 
| |
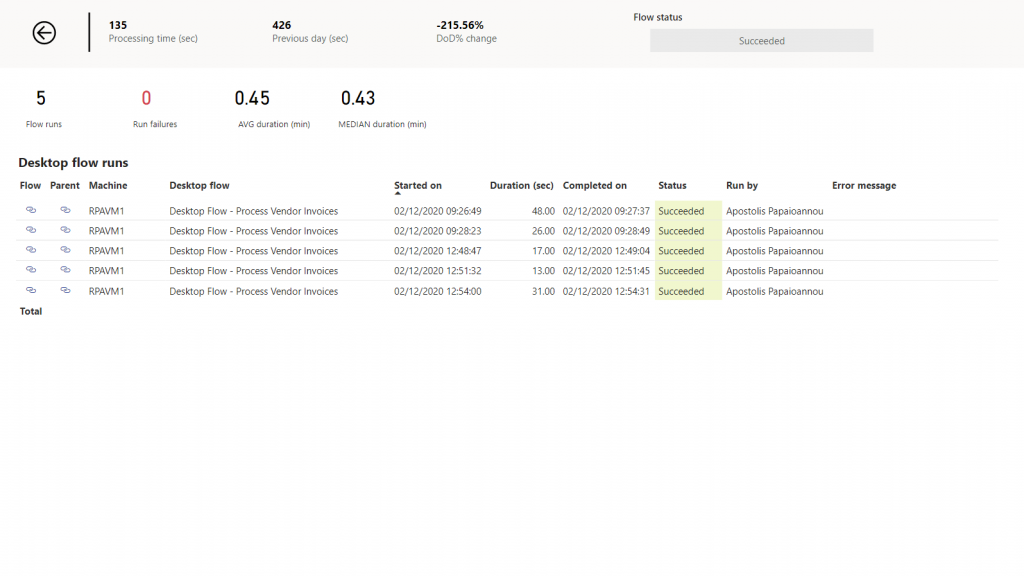
Run performance | ||
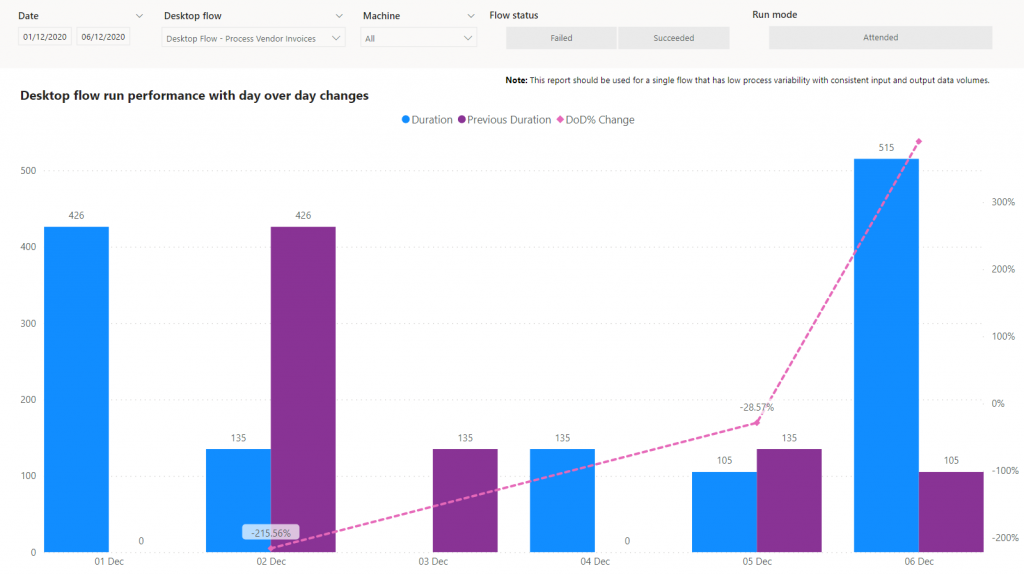 | The Run performance report shows flow run performances with day-over-day changes. By right-clicking you’ll be able to drill-through to the flow runs of that specific data point (e.g. duration for runs on 2021-1-31).
| |
Control chart | ||
| The Control chart report shows flows that occasionally or consistently perform outside of upper and lower control limits. The default control limits have been defined with n-standard deviations and control variability around the mean processing time for a particular day and flow. | 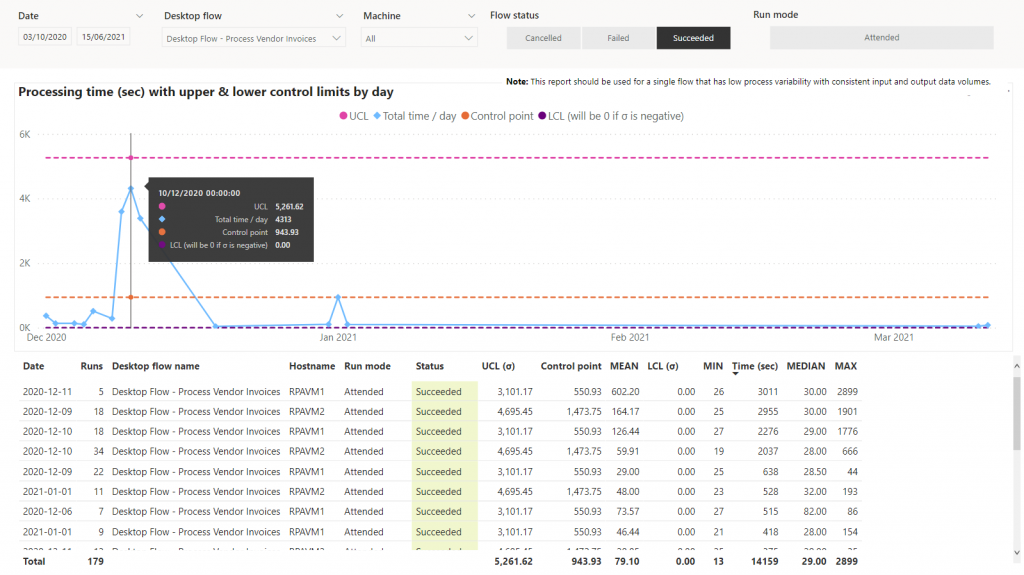
| |
Script actions | ||
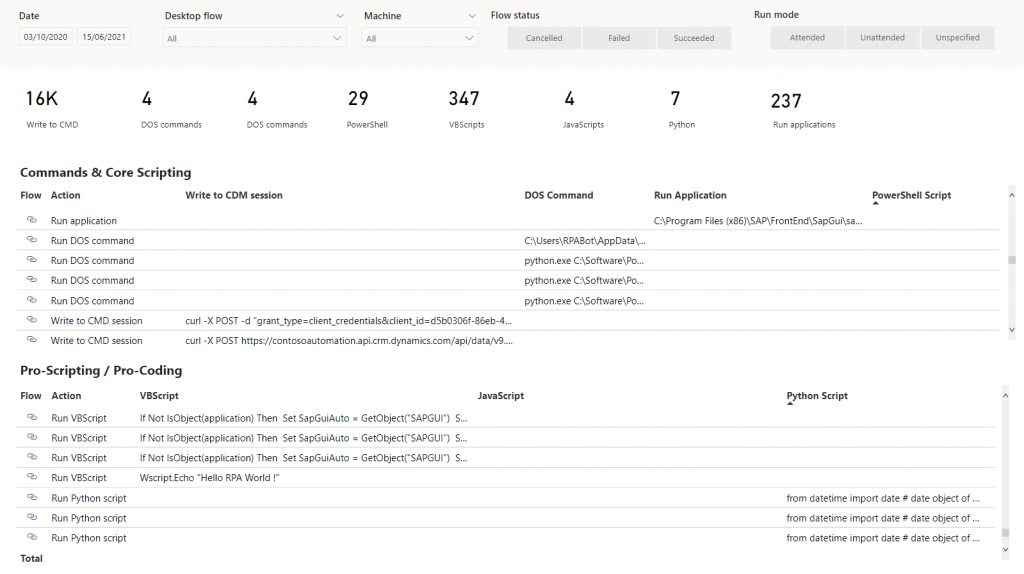 | The Script actions report provides an overview of all desktop flows that contain at least one scripting action or command line commands. These scripting insights will allow you to further strengthen your security and governance strategies.
| |
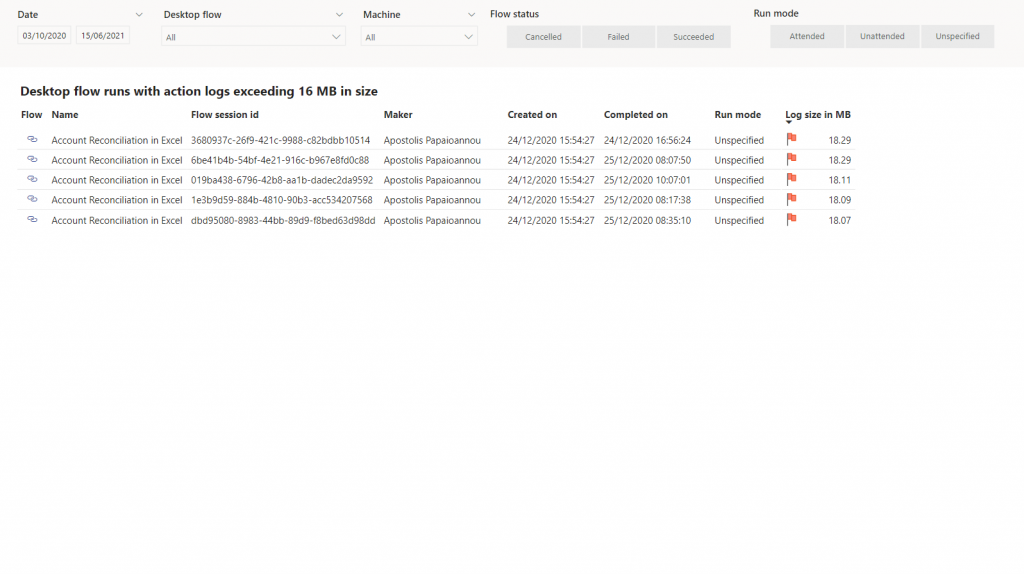
Large logs | ||
| The Large logs report will list all desktop flow runs that have an action log exceeding 16 MB in log size.
|  | |
Runs (drill-through) | ||
 | The Runs (drill-through) report will be launched when you right click on a row in the Desktop Flow Monitor grid or the Run Perf. Chart report. This report shows all flow runs of a selected flow run.
| |
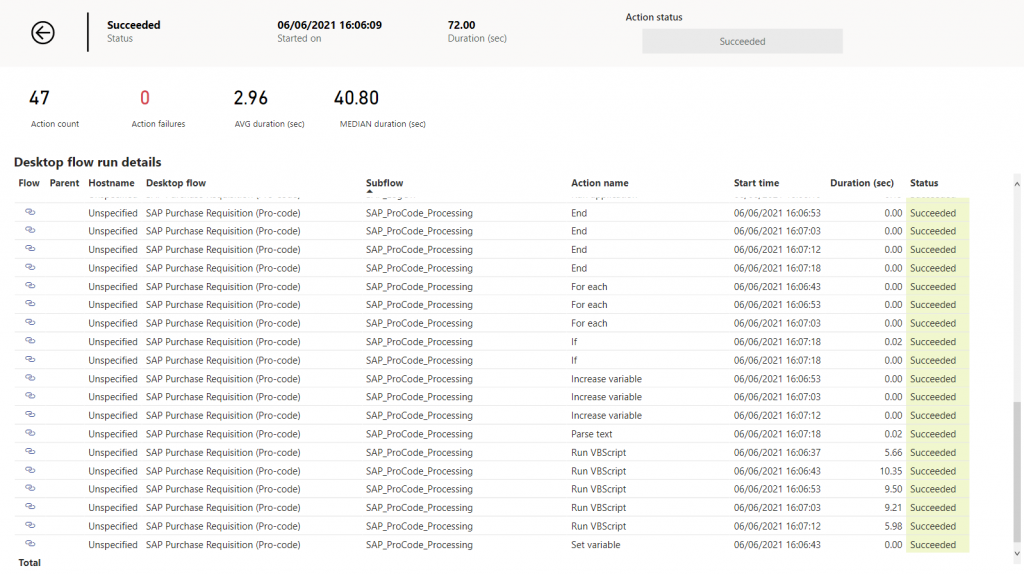
Run details (drill-through) | ||
| The Run details (drill-through) report will be launched when you right click on a row in the Desktop Flow Monitor grid or the Runs (drill-through) report. This report shows the action log history of a selected flow run.
| 
| |
Scripts (drill-through) | ||
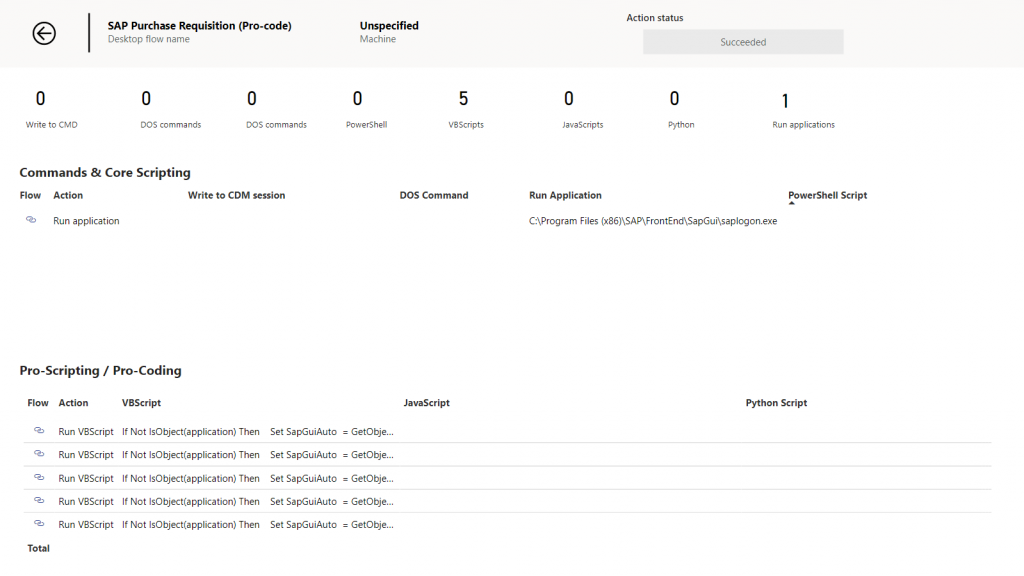 | The Runs (drill-through) report will be launched when you right click on a row in the Desktop Flow Monitor grid or the Run Perf. Chart report. This report shows all flow runs of a selected flow run.
| |
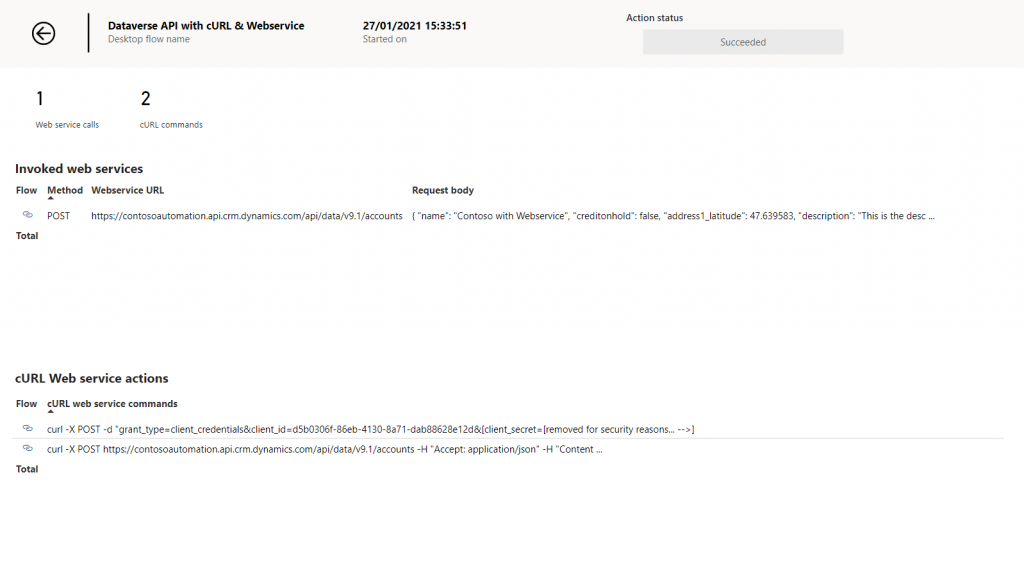
Web Service (drill-through) | ||
| The Web Service (drill-through) report will be launched when you right click on a row in the Desktop Flow Monitor grid or the Runs (drill-through) report. This report shows action log history that are includes REST API and web service interactivity of a selected flow run.
| 
| |
Get the dashboard
Download the dashboard and start analyzing today.
Disclaimer
Although the underlying features and components used to build the Desktop flow Analytics starter template (such as Dataverse APIs, Power Automate and Power BI) are fully supported, the template itself represents sample implementations of these features and comes without any support. Our customers and community can use and customize these reports to implement monitoring capabilities in their organizations.
This Desktop flow Analytics starter template is provided “as is”, without warranty of any kind, express or implied, including but not limited to the warranties of merchantability, fitness for a particular purpose and noninfringement. In no event shall the authors or copyright holders be liable for any claim, damages or other liability, whether in an action of contract, tort or otherwise, arising from, out of or in connection with the software or the use or other dealings in the software