Introduction to Power Automate RPA desktop flows analytics


If you are playing an Admin or CoE (Center of Excellence) role in your organization, the ability to monitor analytics of overall RPA (Robotic Process Automation) desktop flows is critical, so that you can view the overall automation health and adoption status across the whole organization. This becomes more important as you continue to engage more and more citizen developer to participate the automation journey with our low code/no code Platform.
So today we are happy to announce that now you have two different options to monitor the analytics for RPA UI flows — from PPAC (Power Platform Admin Center) or using CoE Starter Kit.
Power Platform Admin Center
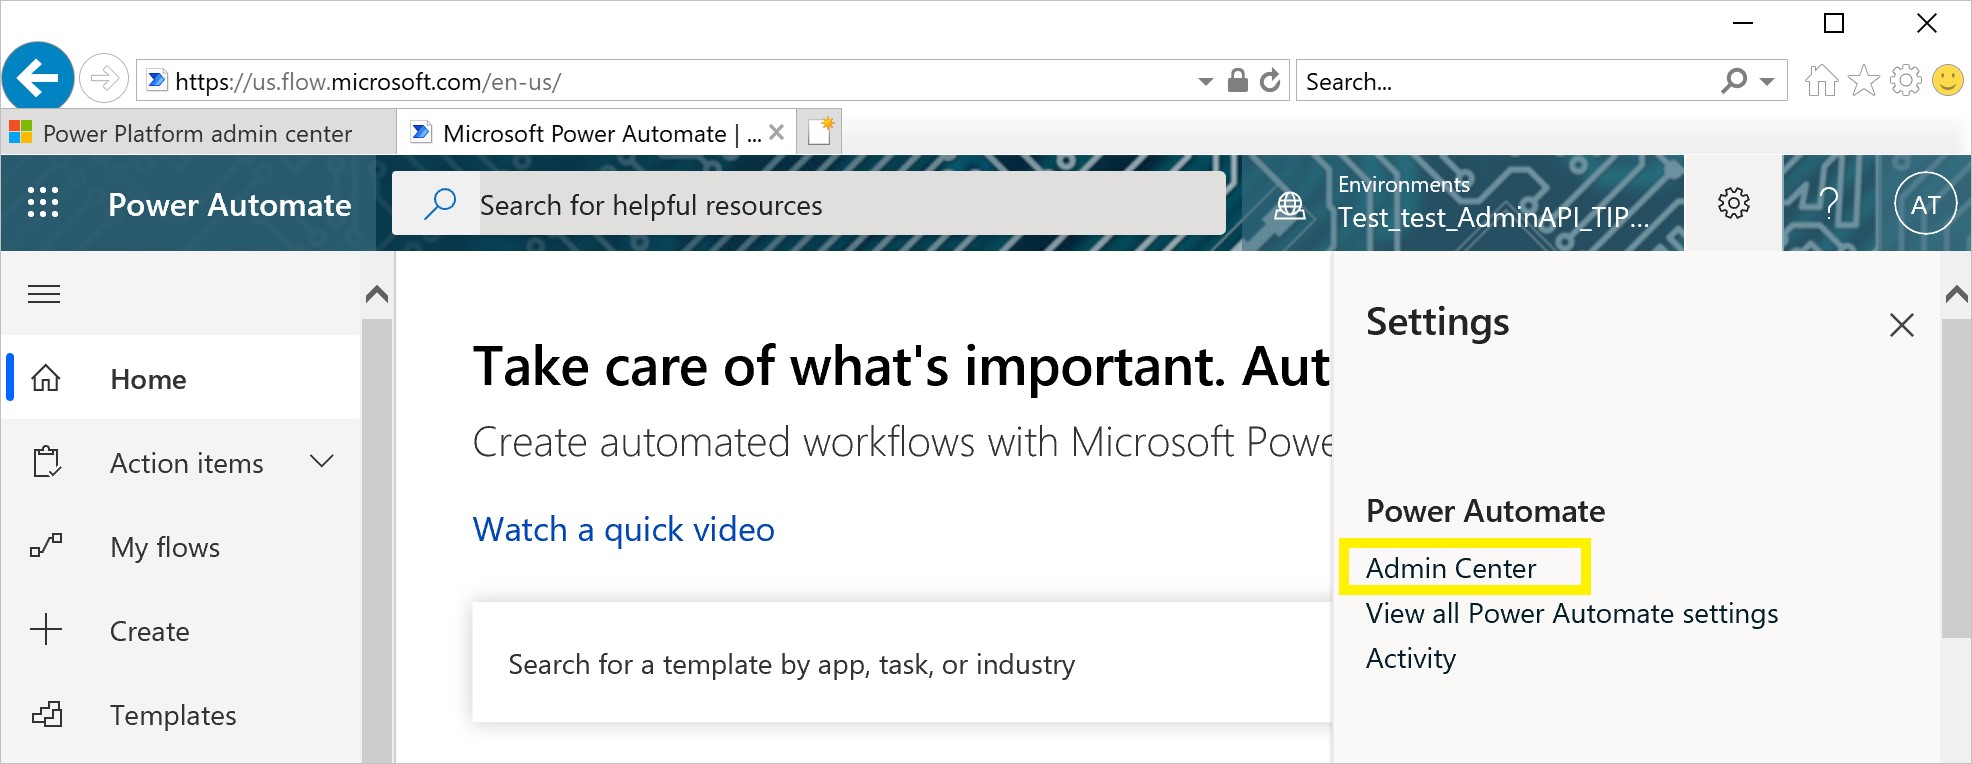
The easiest option for admin/CoE to view analytics is simply to visit PPAC (Power Platform Admin Center). This gives you out of box reports with no installation needed. It is accessible to anyone who has environment admin privilege. To access PPAC reports, you just need to click the Admin Center from the Power Automate portal settings menu.
4 new analytic reports for UI flows are available today, they are Runs, Usage, Created and Errors. More reports will be added in a later time.
After you select the report, you can switch the views between Cloud flows and Desktop flows
You can switch to view analytics for specific environment that you are admin with. You can also change the time period (up to 28 days) to view. Data will be refreshed on a daily base. (Note, tenant level rollup report across multiple environments is not available today, but will be coming later)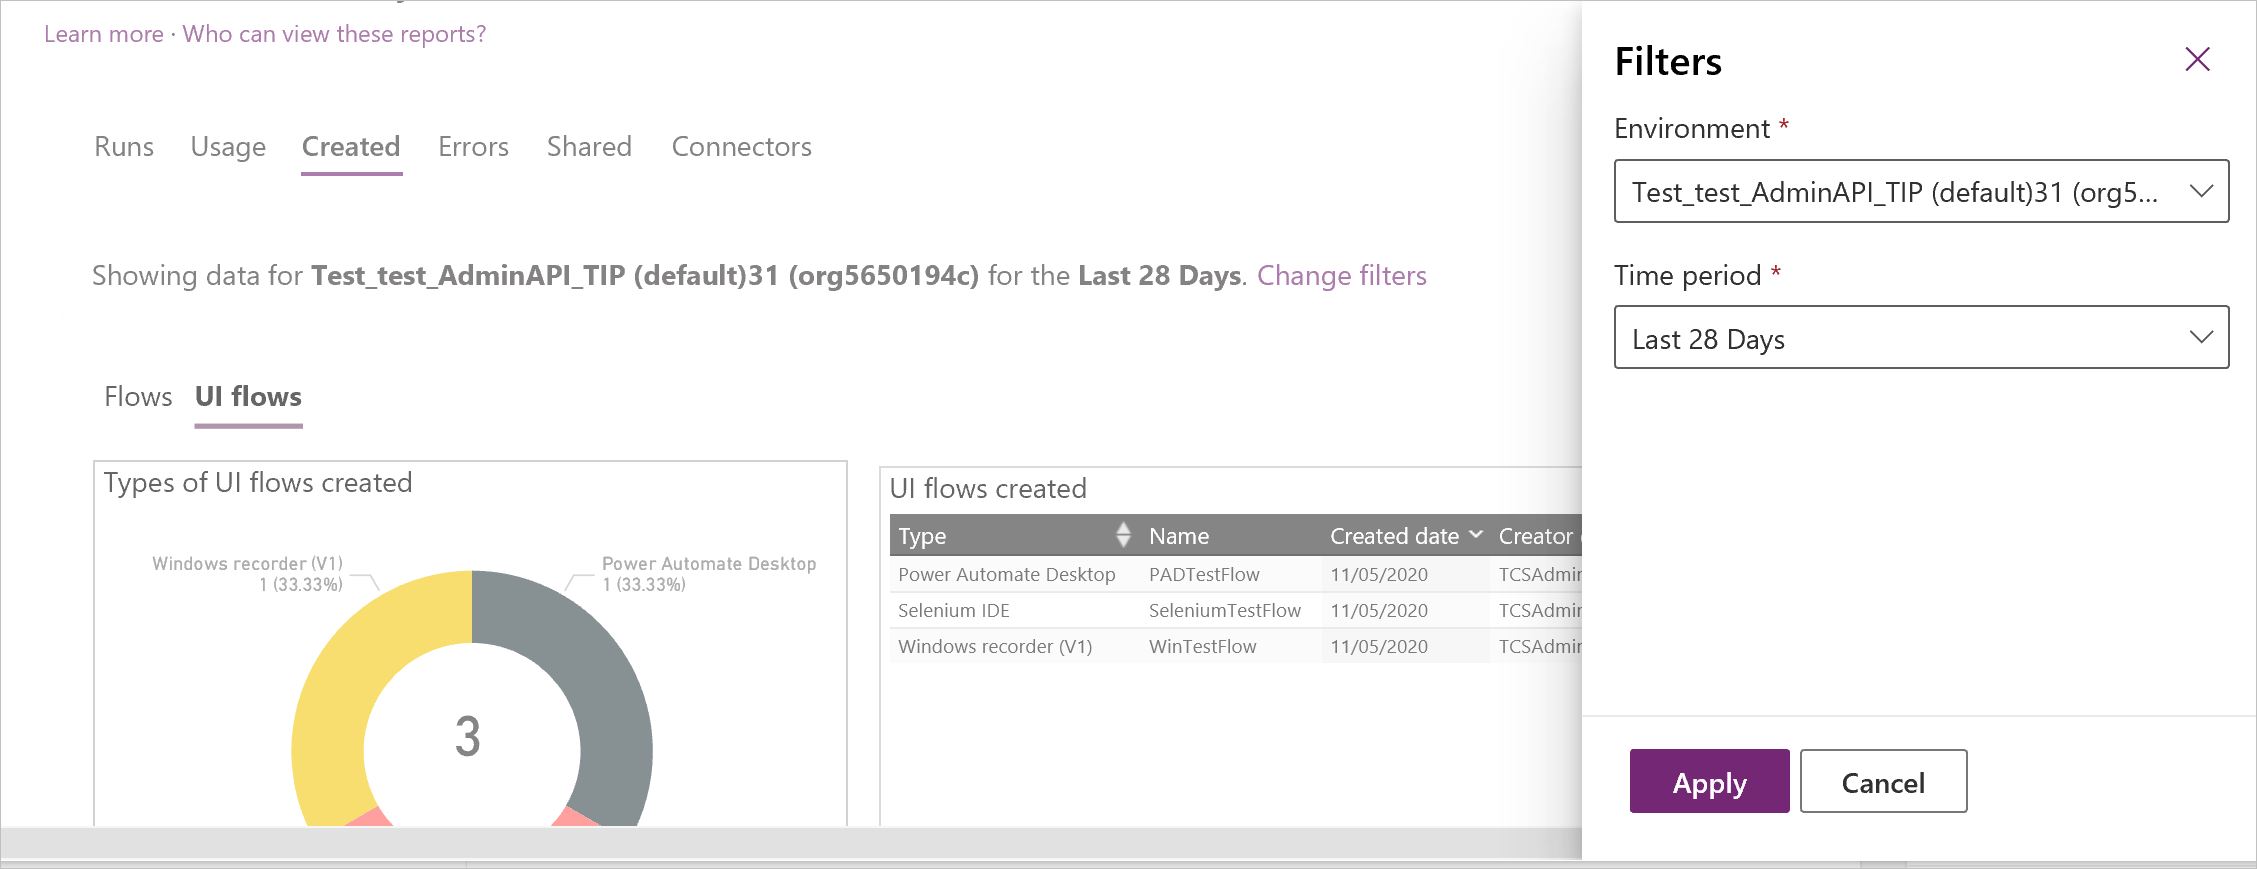
After you switch to Desktop flows view, you can apply detail filters to see data for specific types of desktop flows, e.g. Power Automate Desktop, Selenium IDE or Windows recorder (V1) type, as well as to filter by attended or unattended run mode.
The 1st report is Runs which gives you an overview of daily, weekly and monthly desktop flows run statics, with trending lines and run results breakdown (e.g. success/failure/cancel) This report gives insights on how actively desktop flows are used in each environment.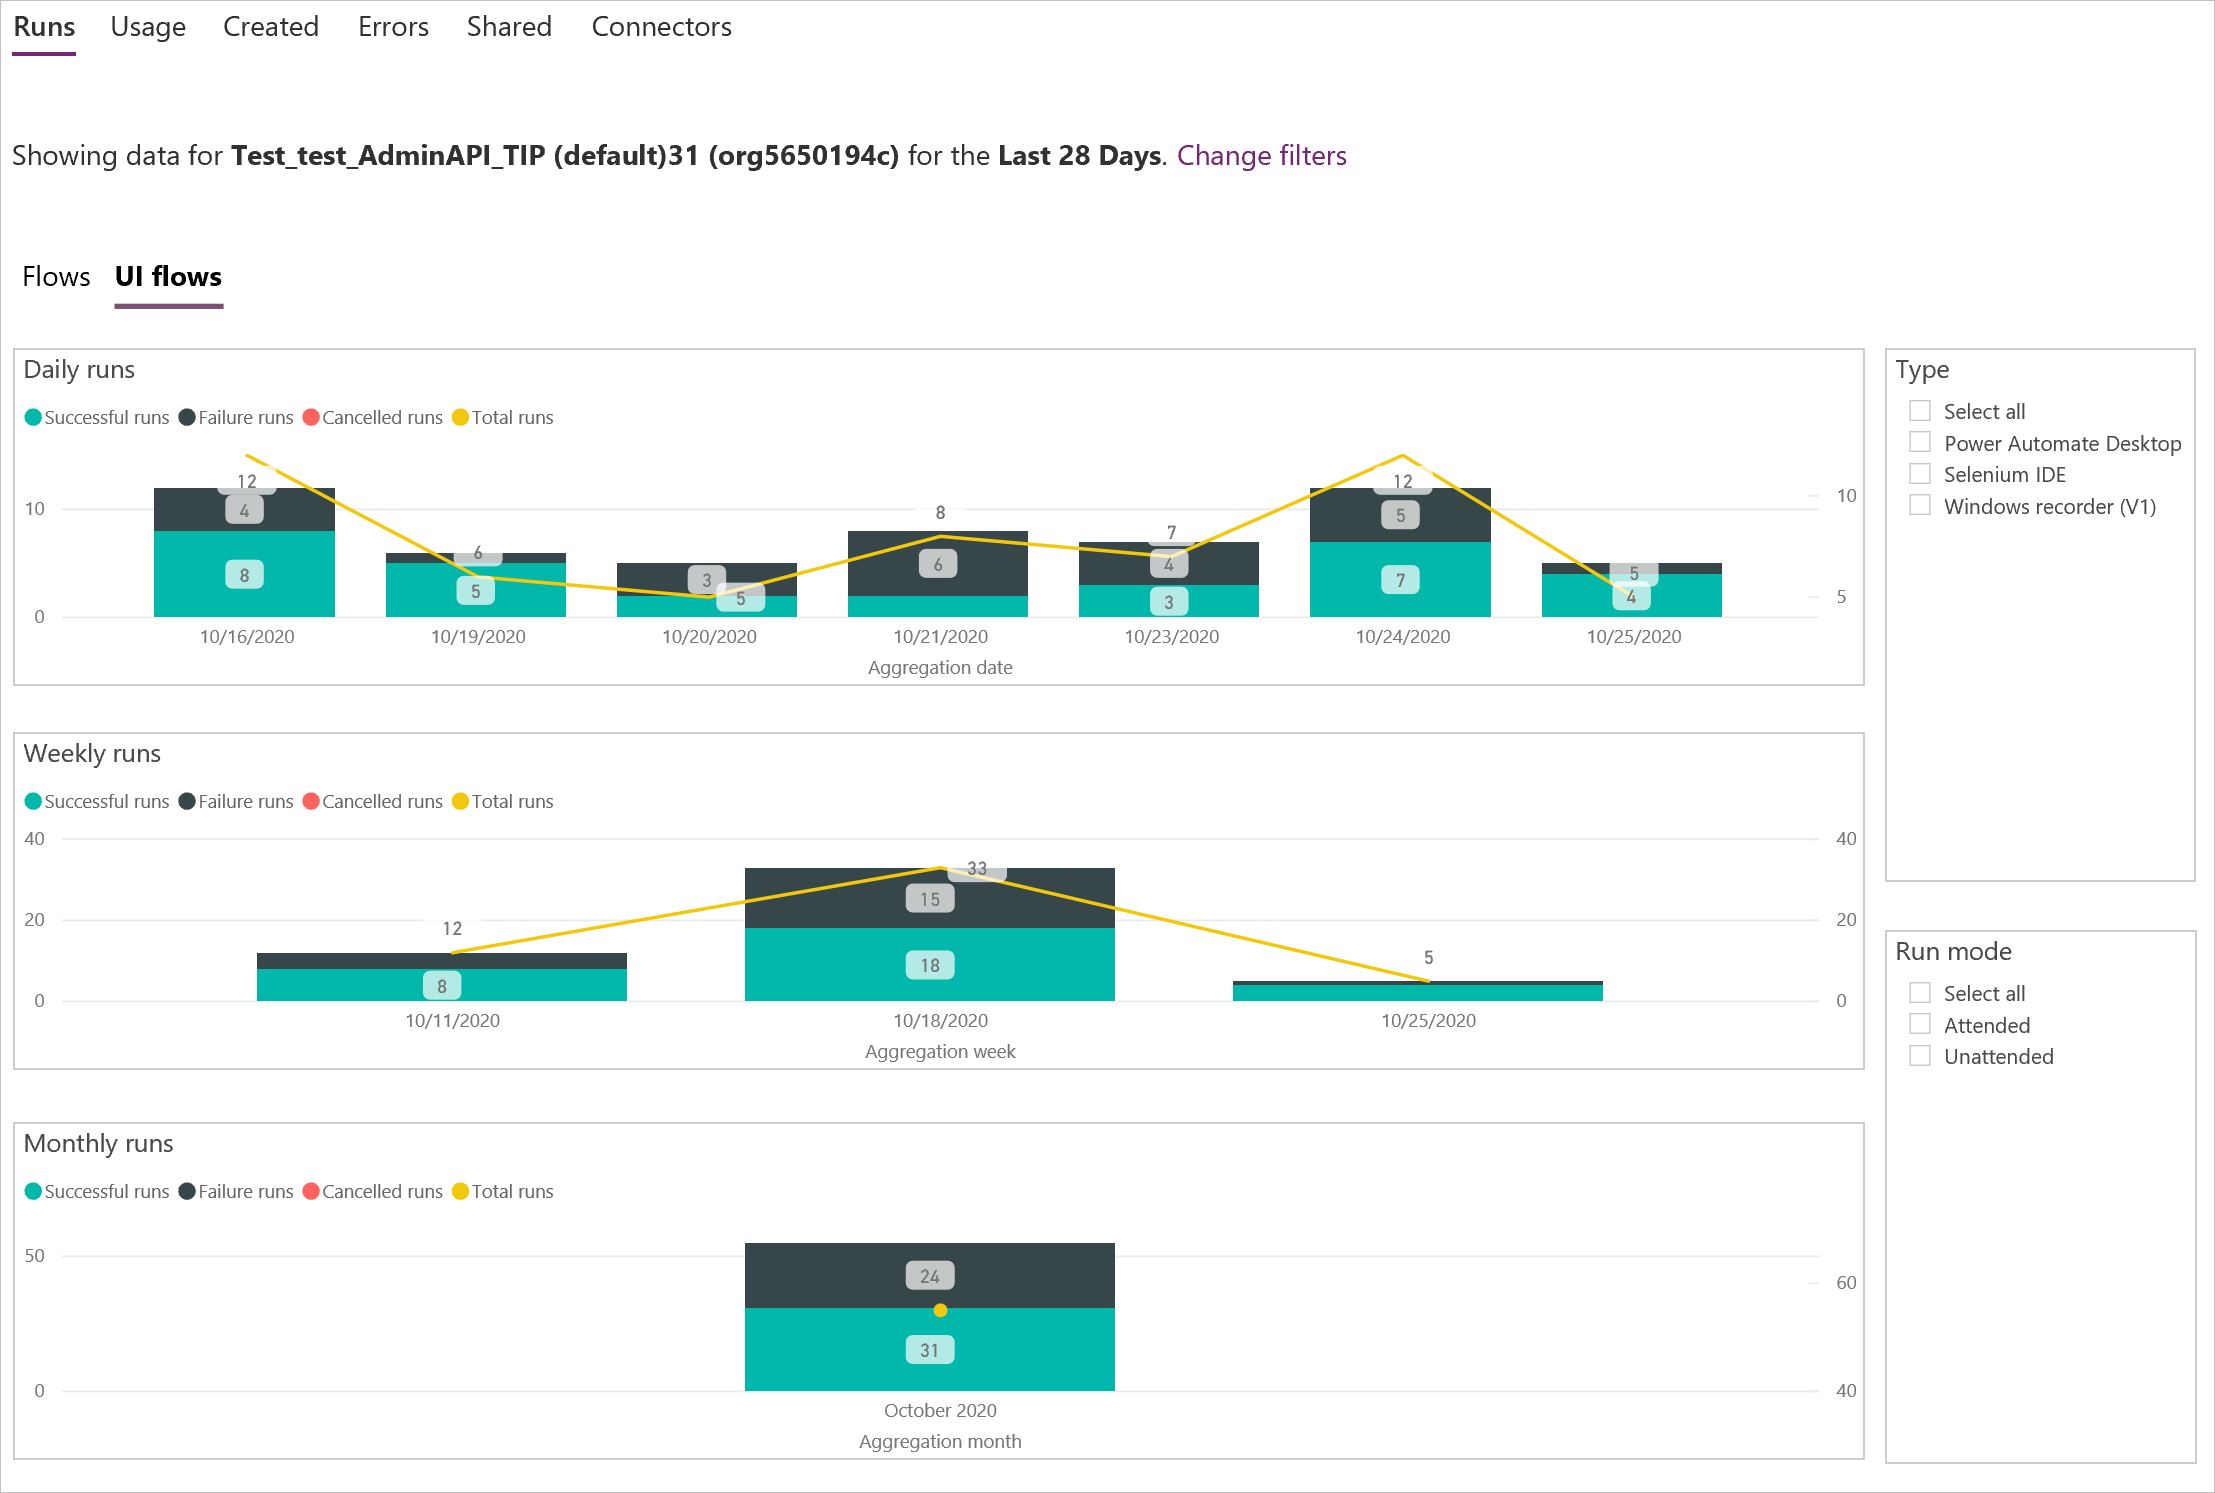
The 2nd report is Usage which shows you the desktop flows that being used most so you can get a good idea about your automation inventory.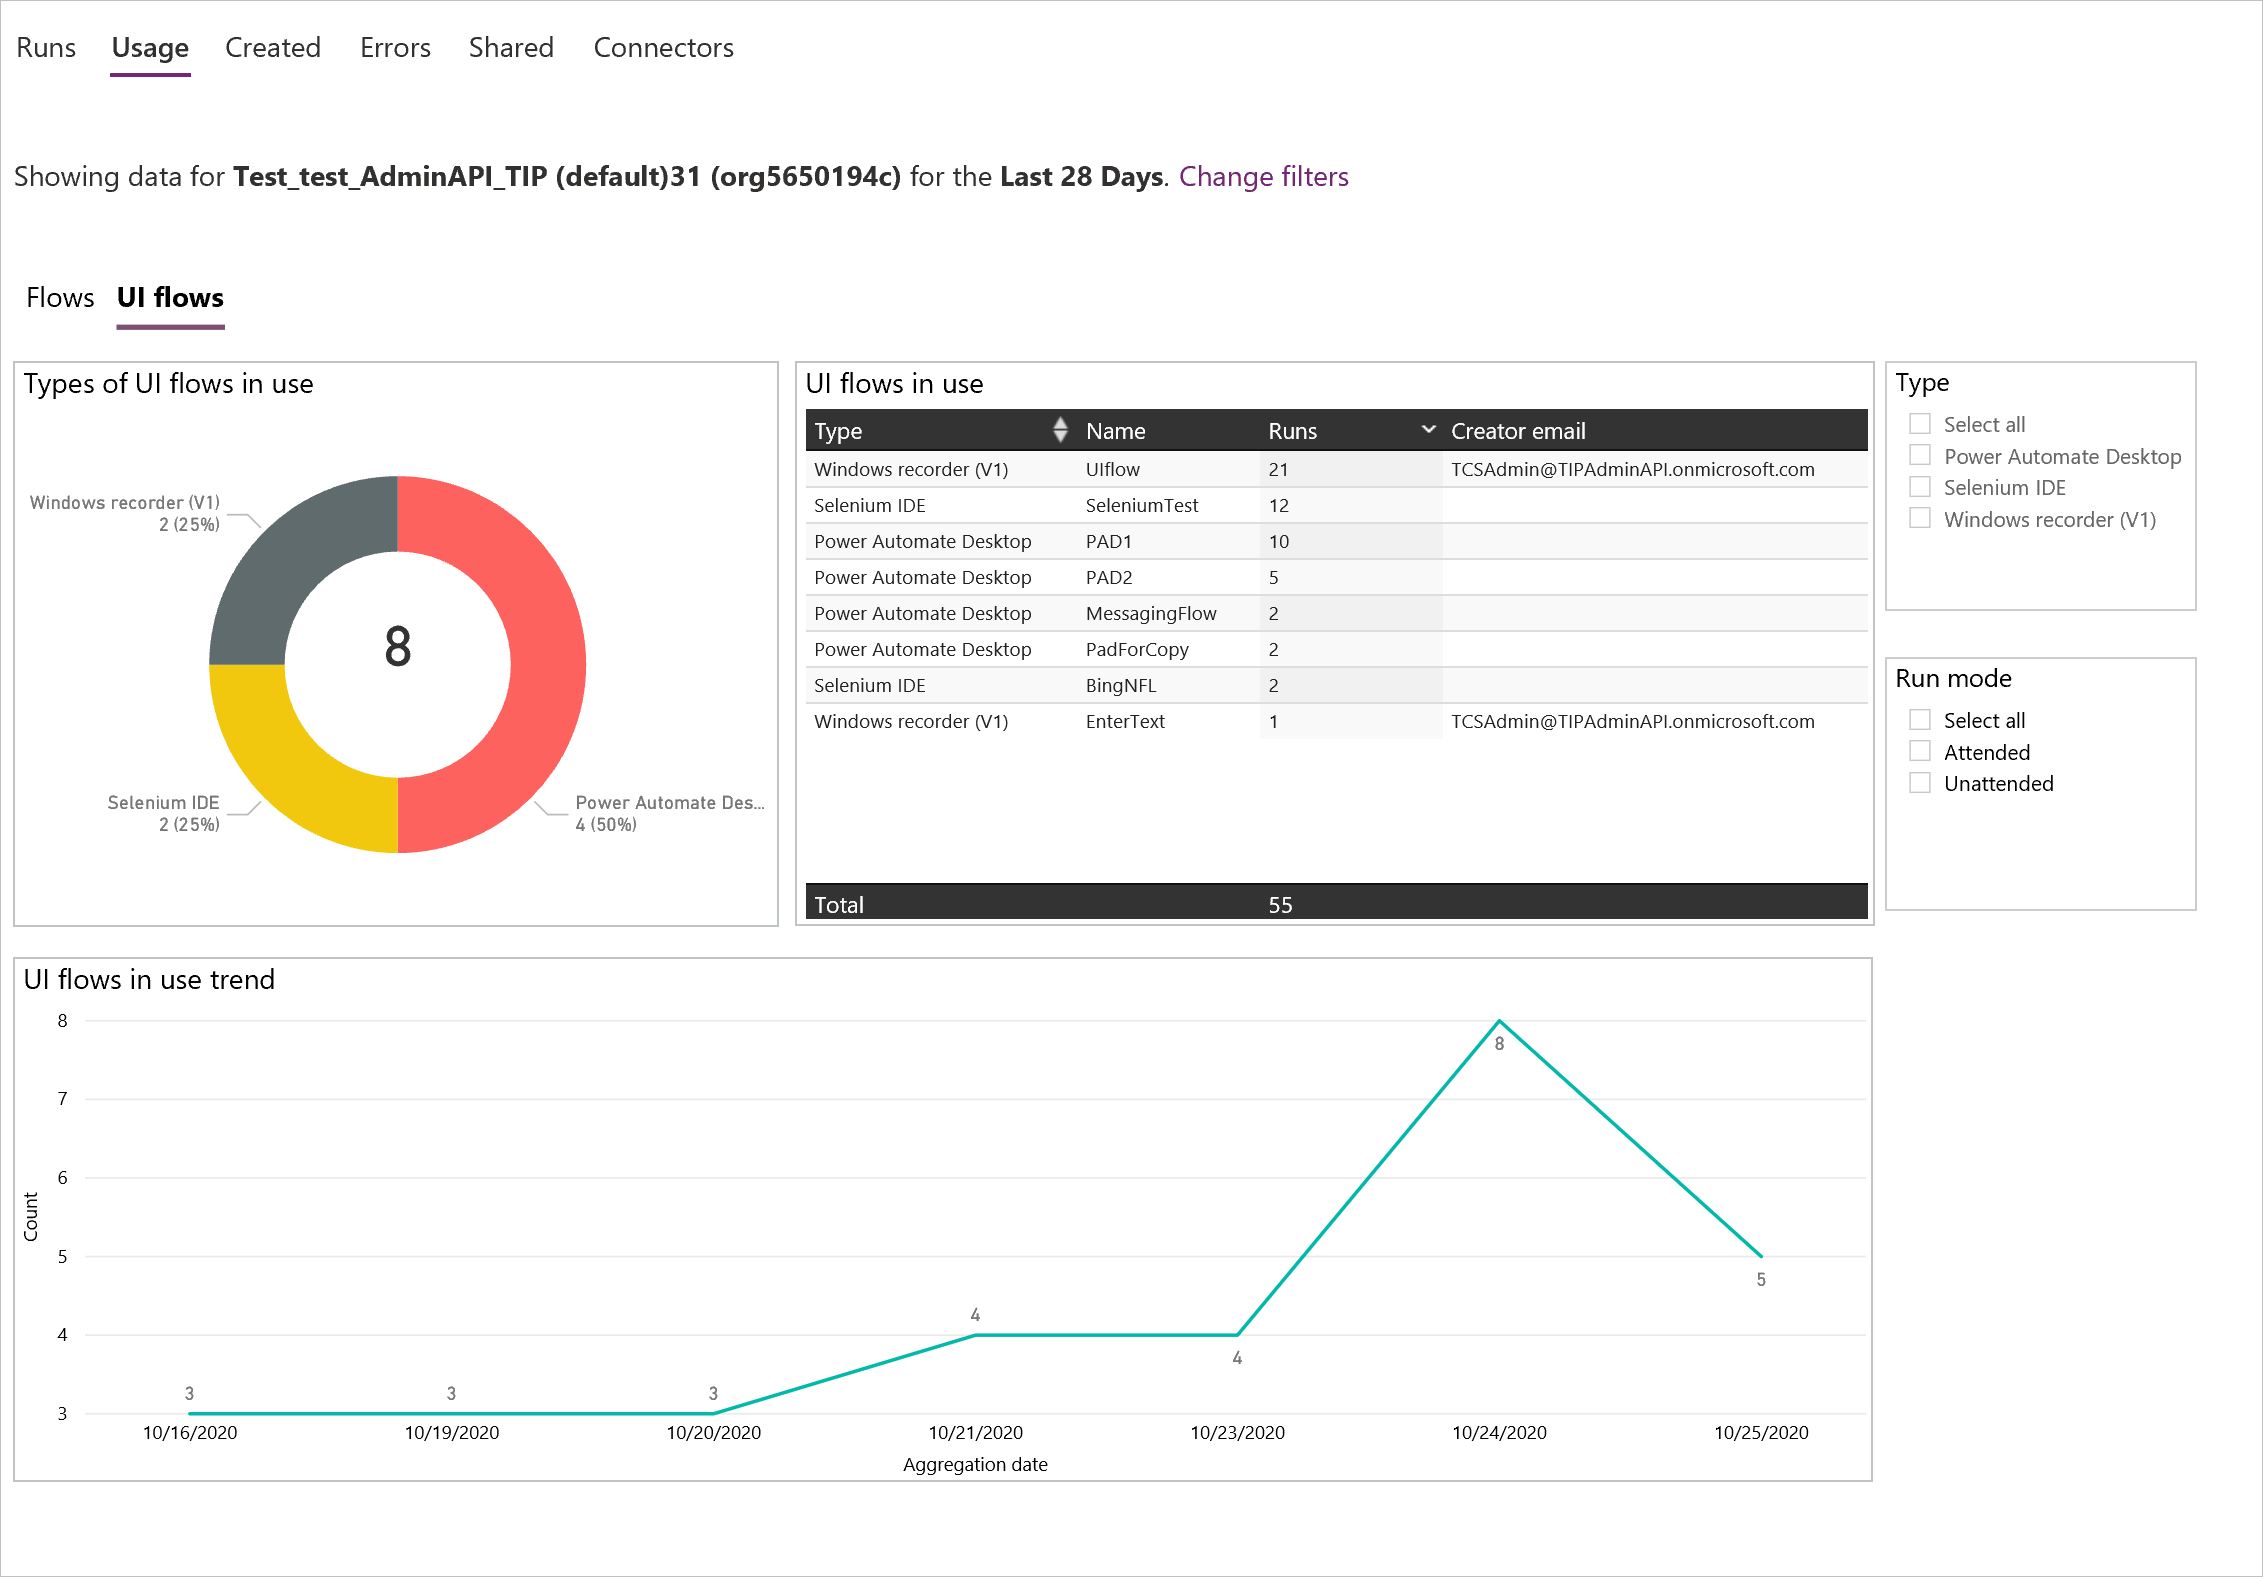
The 3rd report is Created which shows you analytics against recent created new desktop flows, so you understand how active your desktop flows makers and who they are. (Note, you must upgrade the Power Automate Desktop app to the GA version, released 12/09/2020 or later, in order to generate correct data for this report)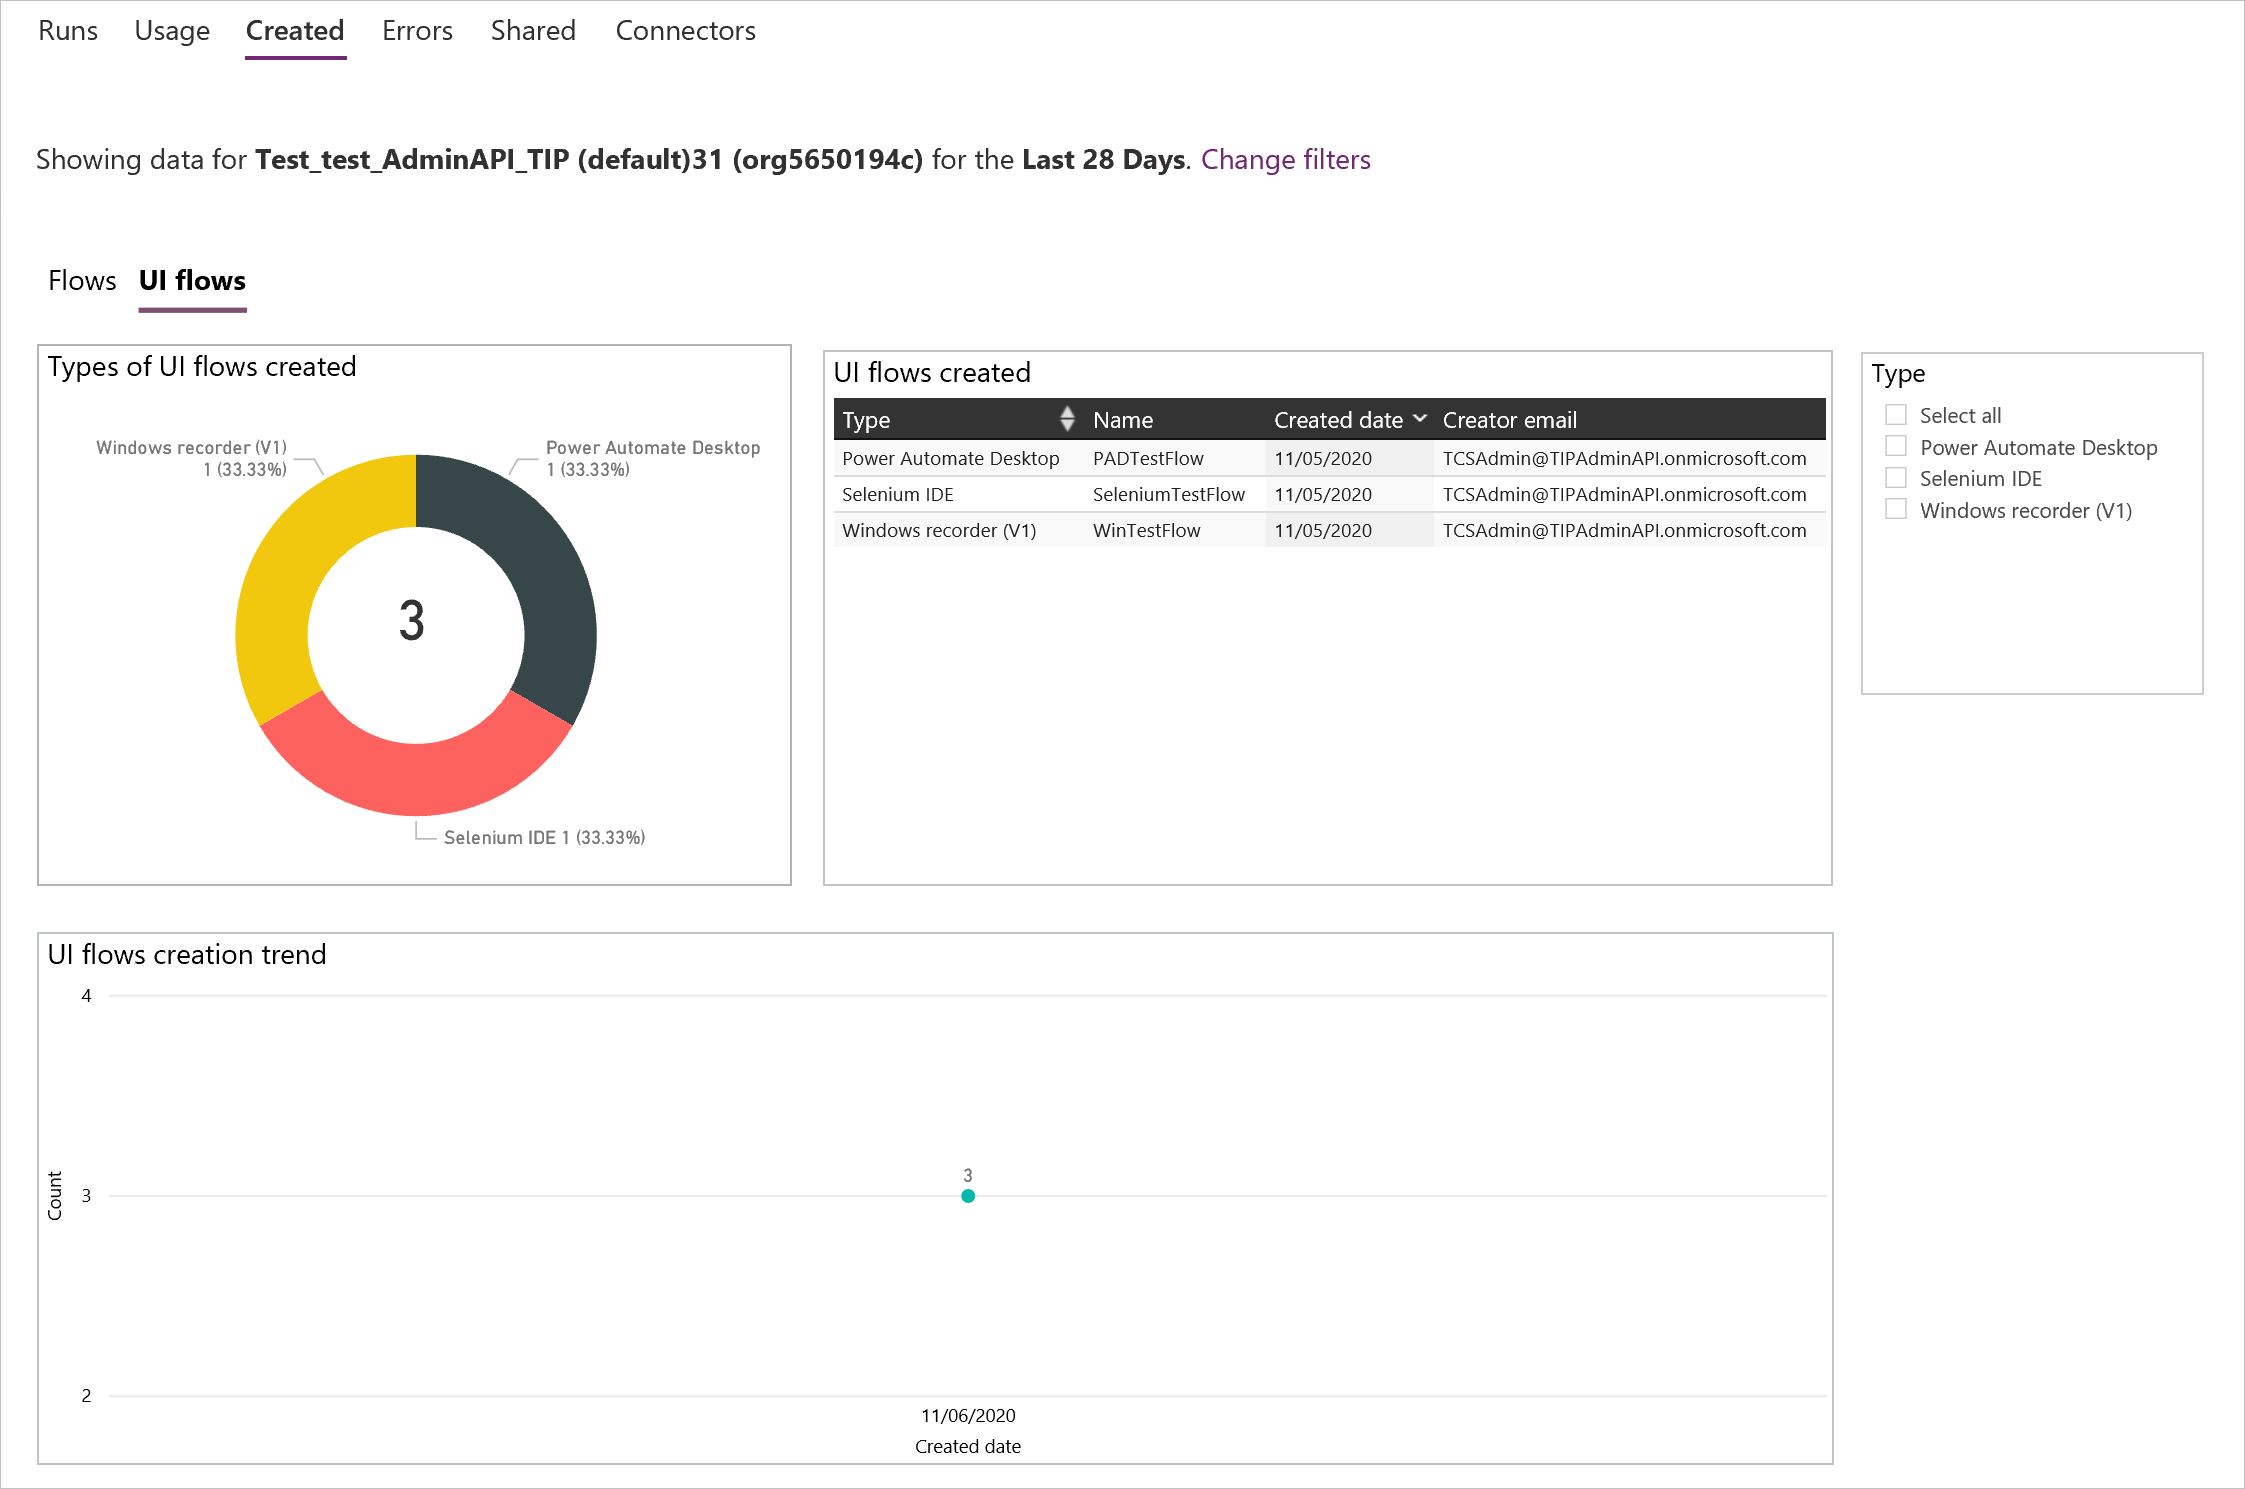
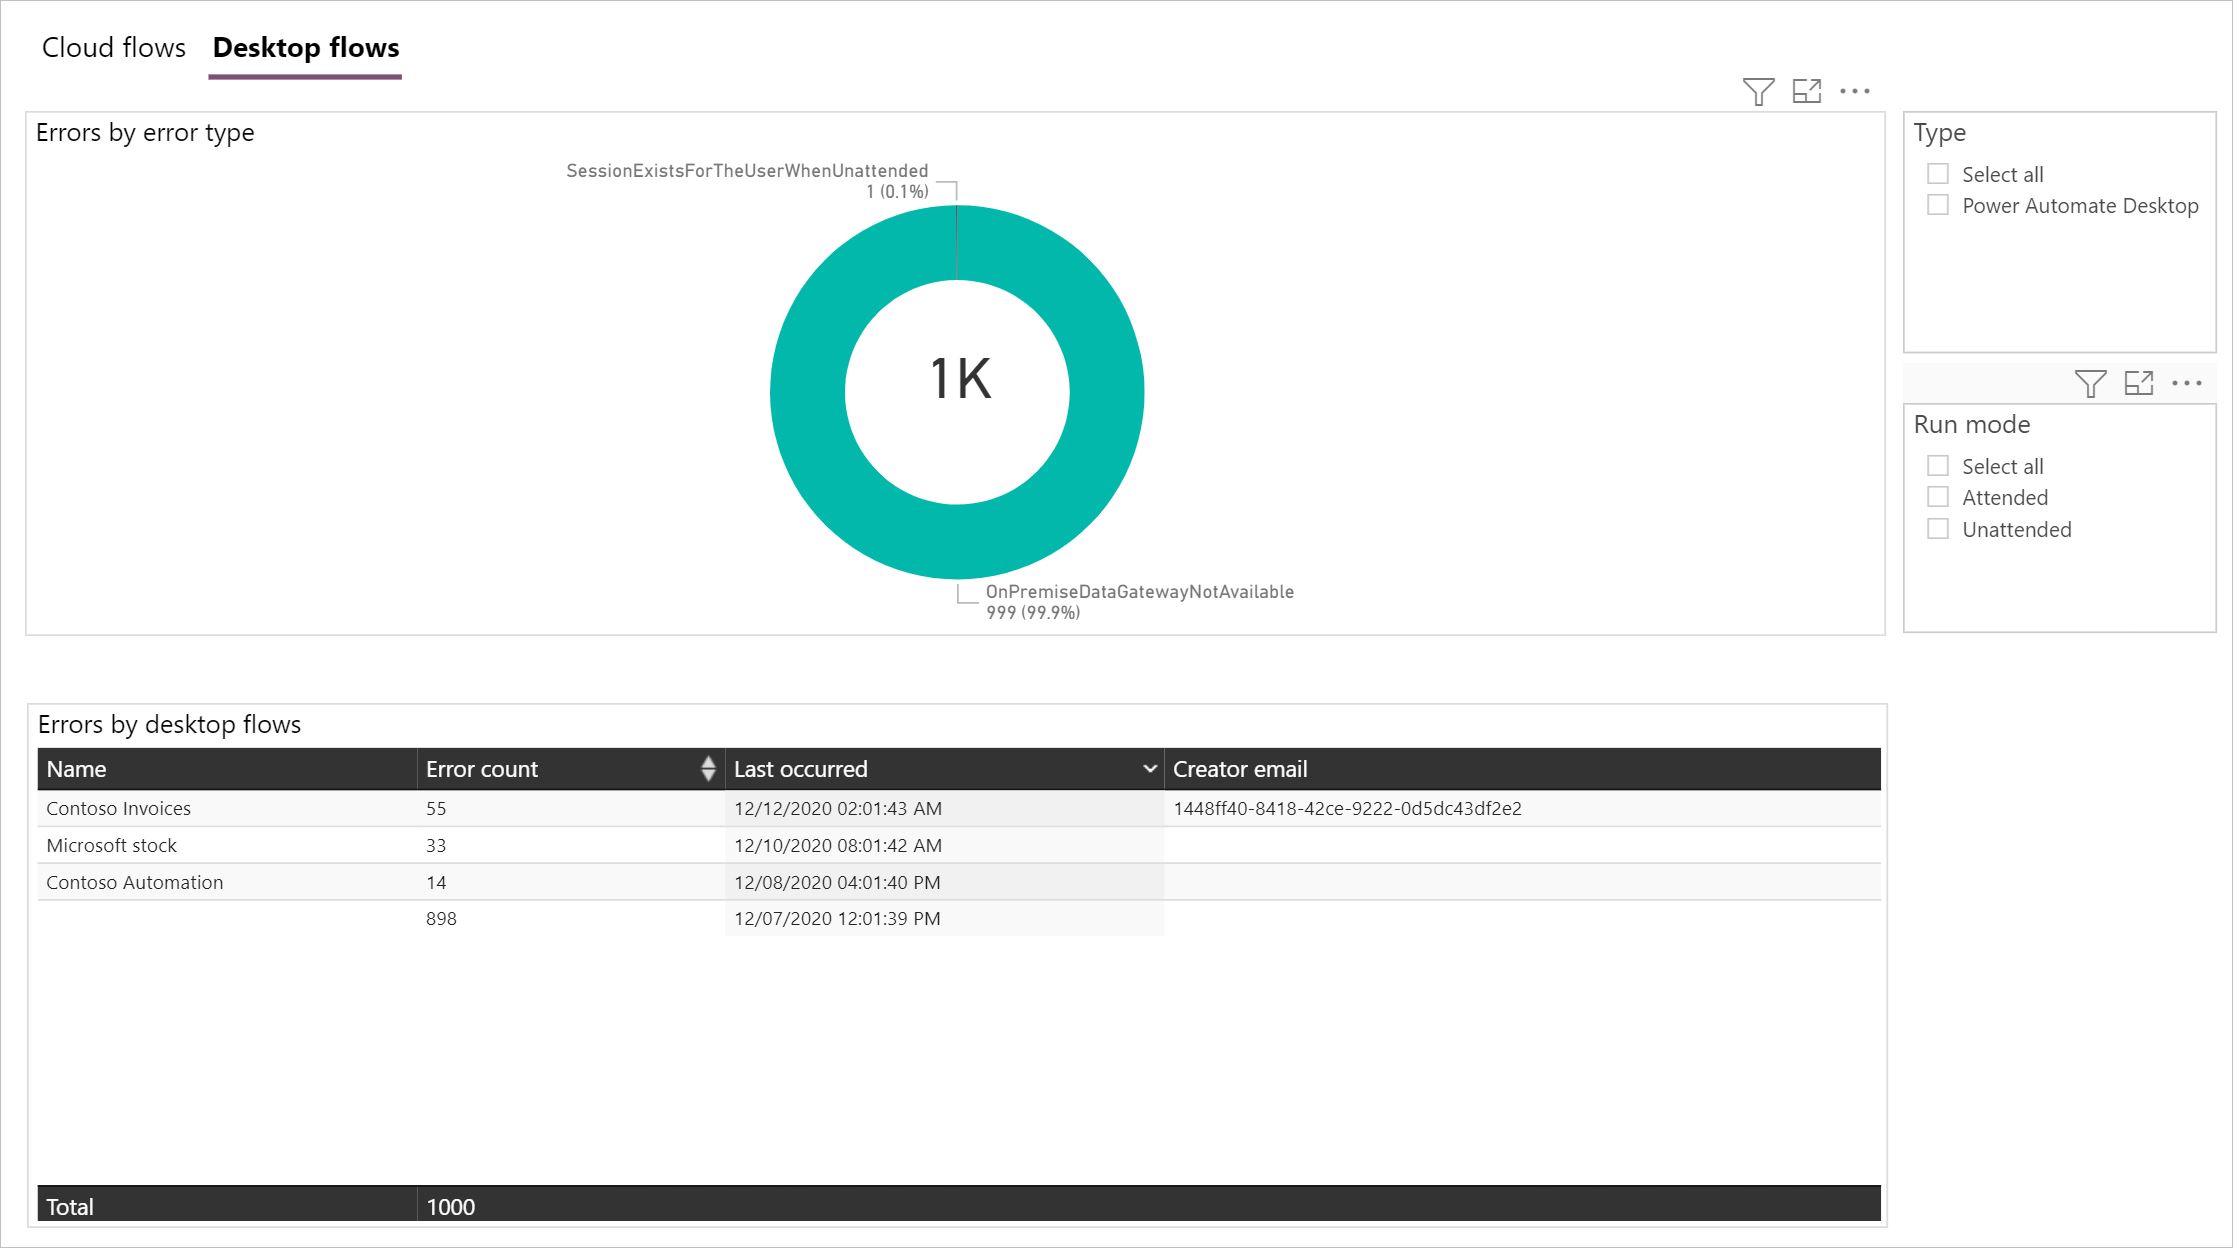
The 4th report is Errors which shows the top error types that have been caused failures in your desktop flows. (Note, you must upgrade the Power Automate Desktop app to the GA version, released 12/09/2020 or later, in order to generate correct data for this report)
Center of Excellence starter kit
Above is the introduction for analytics through PPAC. The other option to view analytics is to use the powerful CoE Starter Kit (Microsoft Power Platform Center of Excellence) The CoE Starter Kit will be useful if you need more and richer governance and monitoring capabilities which cannot be met yet using the built-in PPAC reports. Or in some situations, you wish to build your own customized reports or setup some configurable alerts. You will find CoE Starter Kit to be a handy tool for those needs. It does require addtional setup and configurations but many admins/CoEs found it is really worth the efforts. To learn more about CoE Starter Kit and get started, please check out here.
Hope you enjoy those new analytics features of desktop flows. Please start using them and welcome to provide your feedbacks through Power Platform forum.